A Local Workbench for
Quantitative Risk Assessment

Run and analyze quantitative risk assessments using the Open FAIR taxonomy


Group and analyze scenarios with portfolios
Portfolios are groups of scenarios that are simulated together, such as a business unit, risk class, or system. When a portfolio is simulated, each member scenario's annual losses are summed within each simulated year, producing a single aggregate loss distribution.
Export a variety of editable reports in Word and Excel format
CRQ Pro is designed for the data to be used across different reporting mediums. You can export a variety of reports from a single scenario to full portfolios, or even compare treatment options. Reports are exported in Word and Excel formats so that you can tailor the reporting to your needs and stakeholders.

Save time with re-usable building blocks called components
A component is a reusable piece of a FAIR model: a threat event frequency you have researched, a standard loss table, a vulnerability estimate for a shared control environment. Define it once, link it into any number of scenarios, and update it in one place.
Reporting based on leading authorities



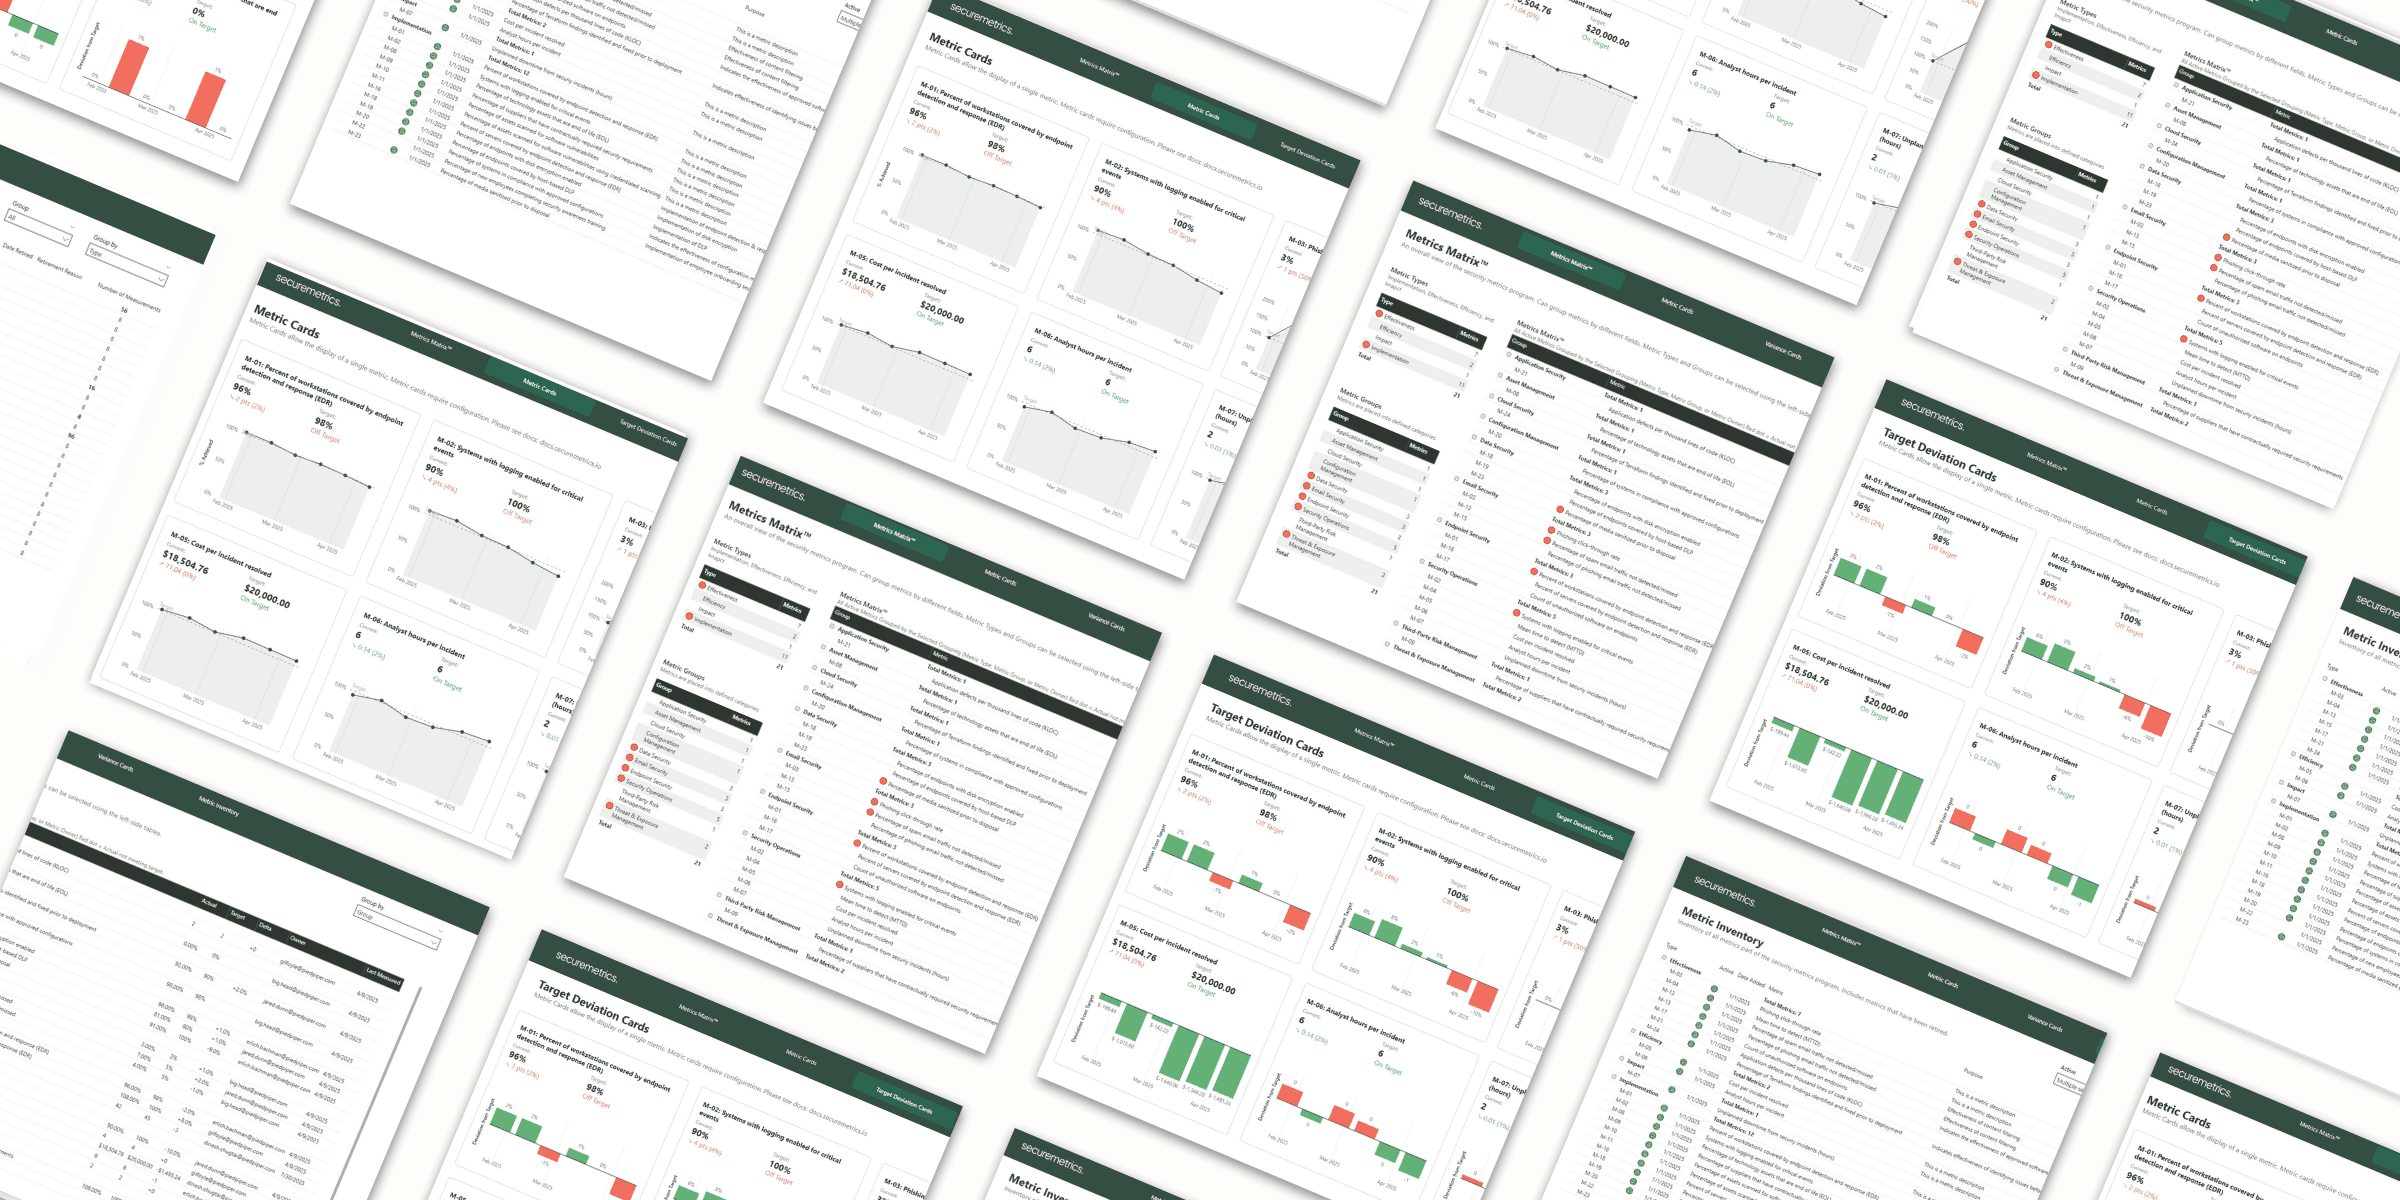
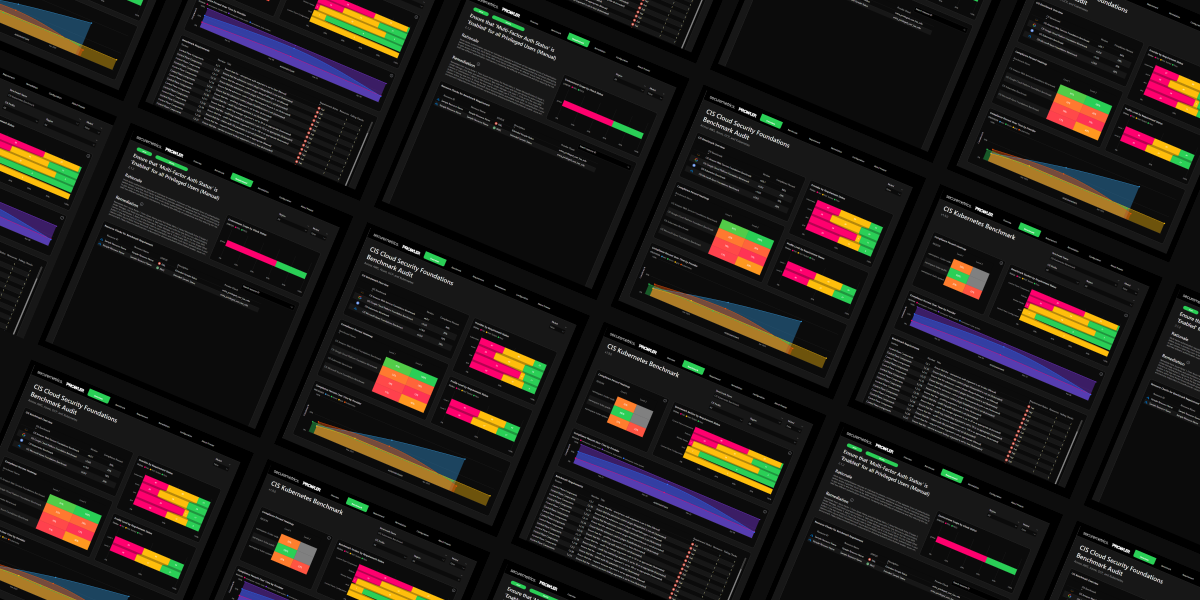
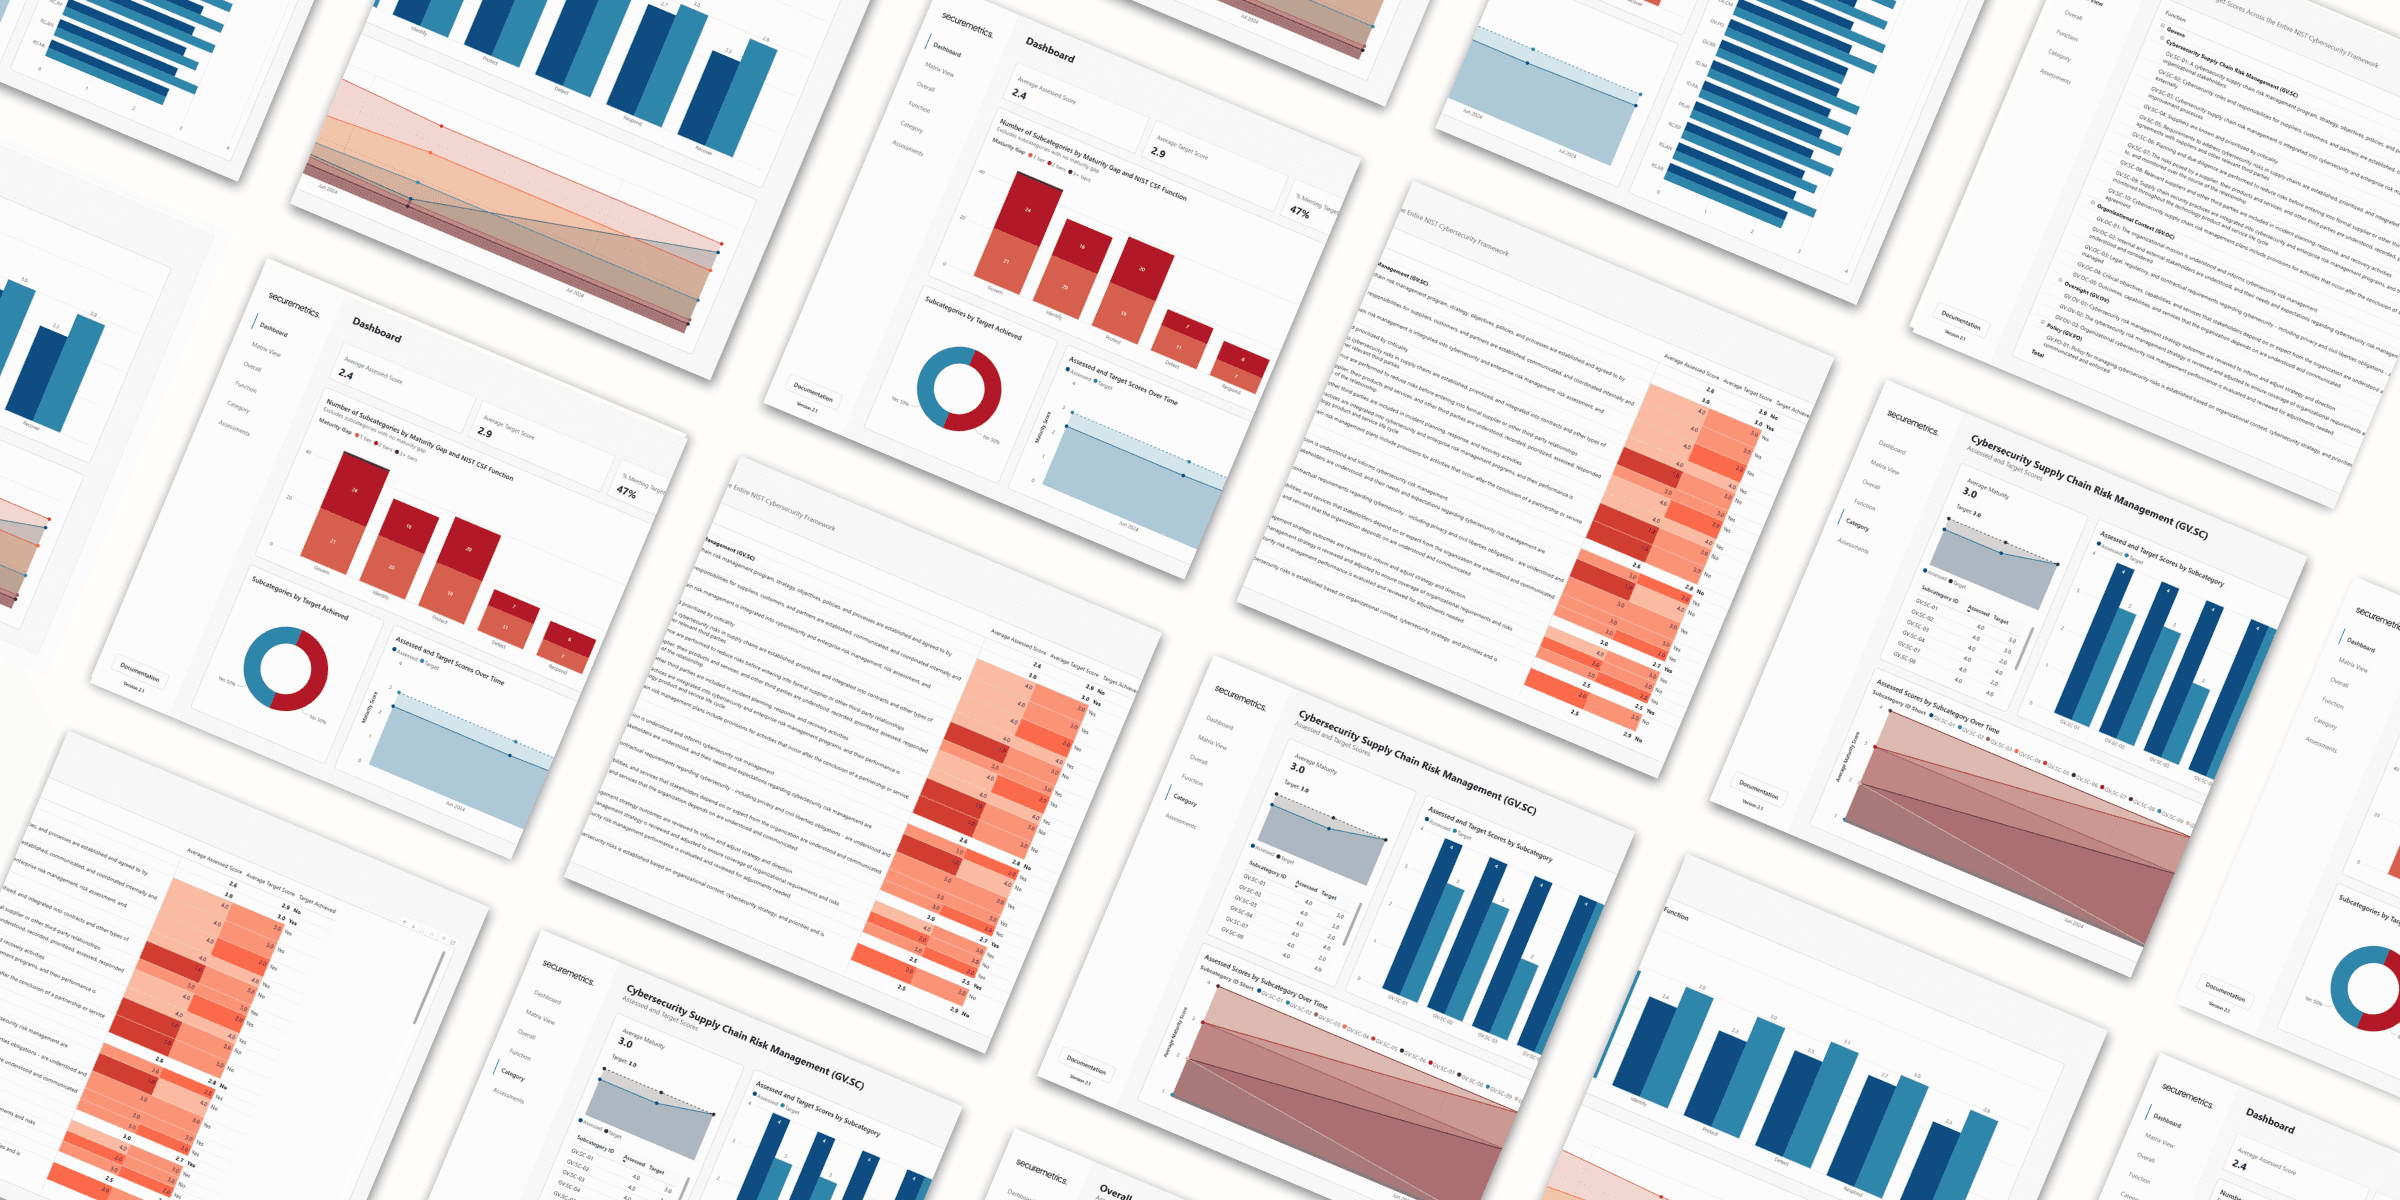
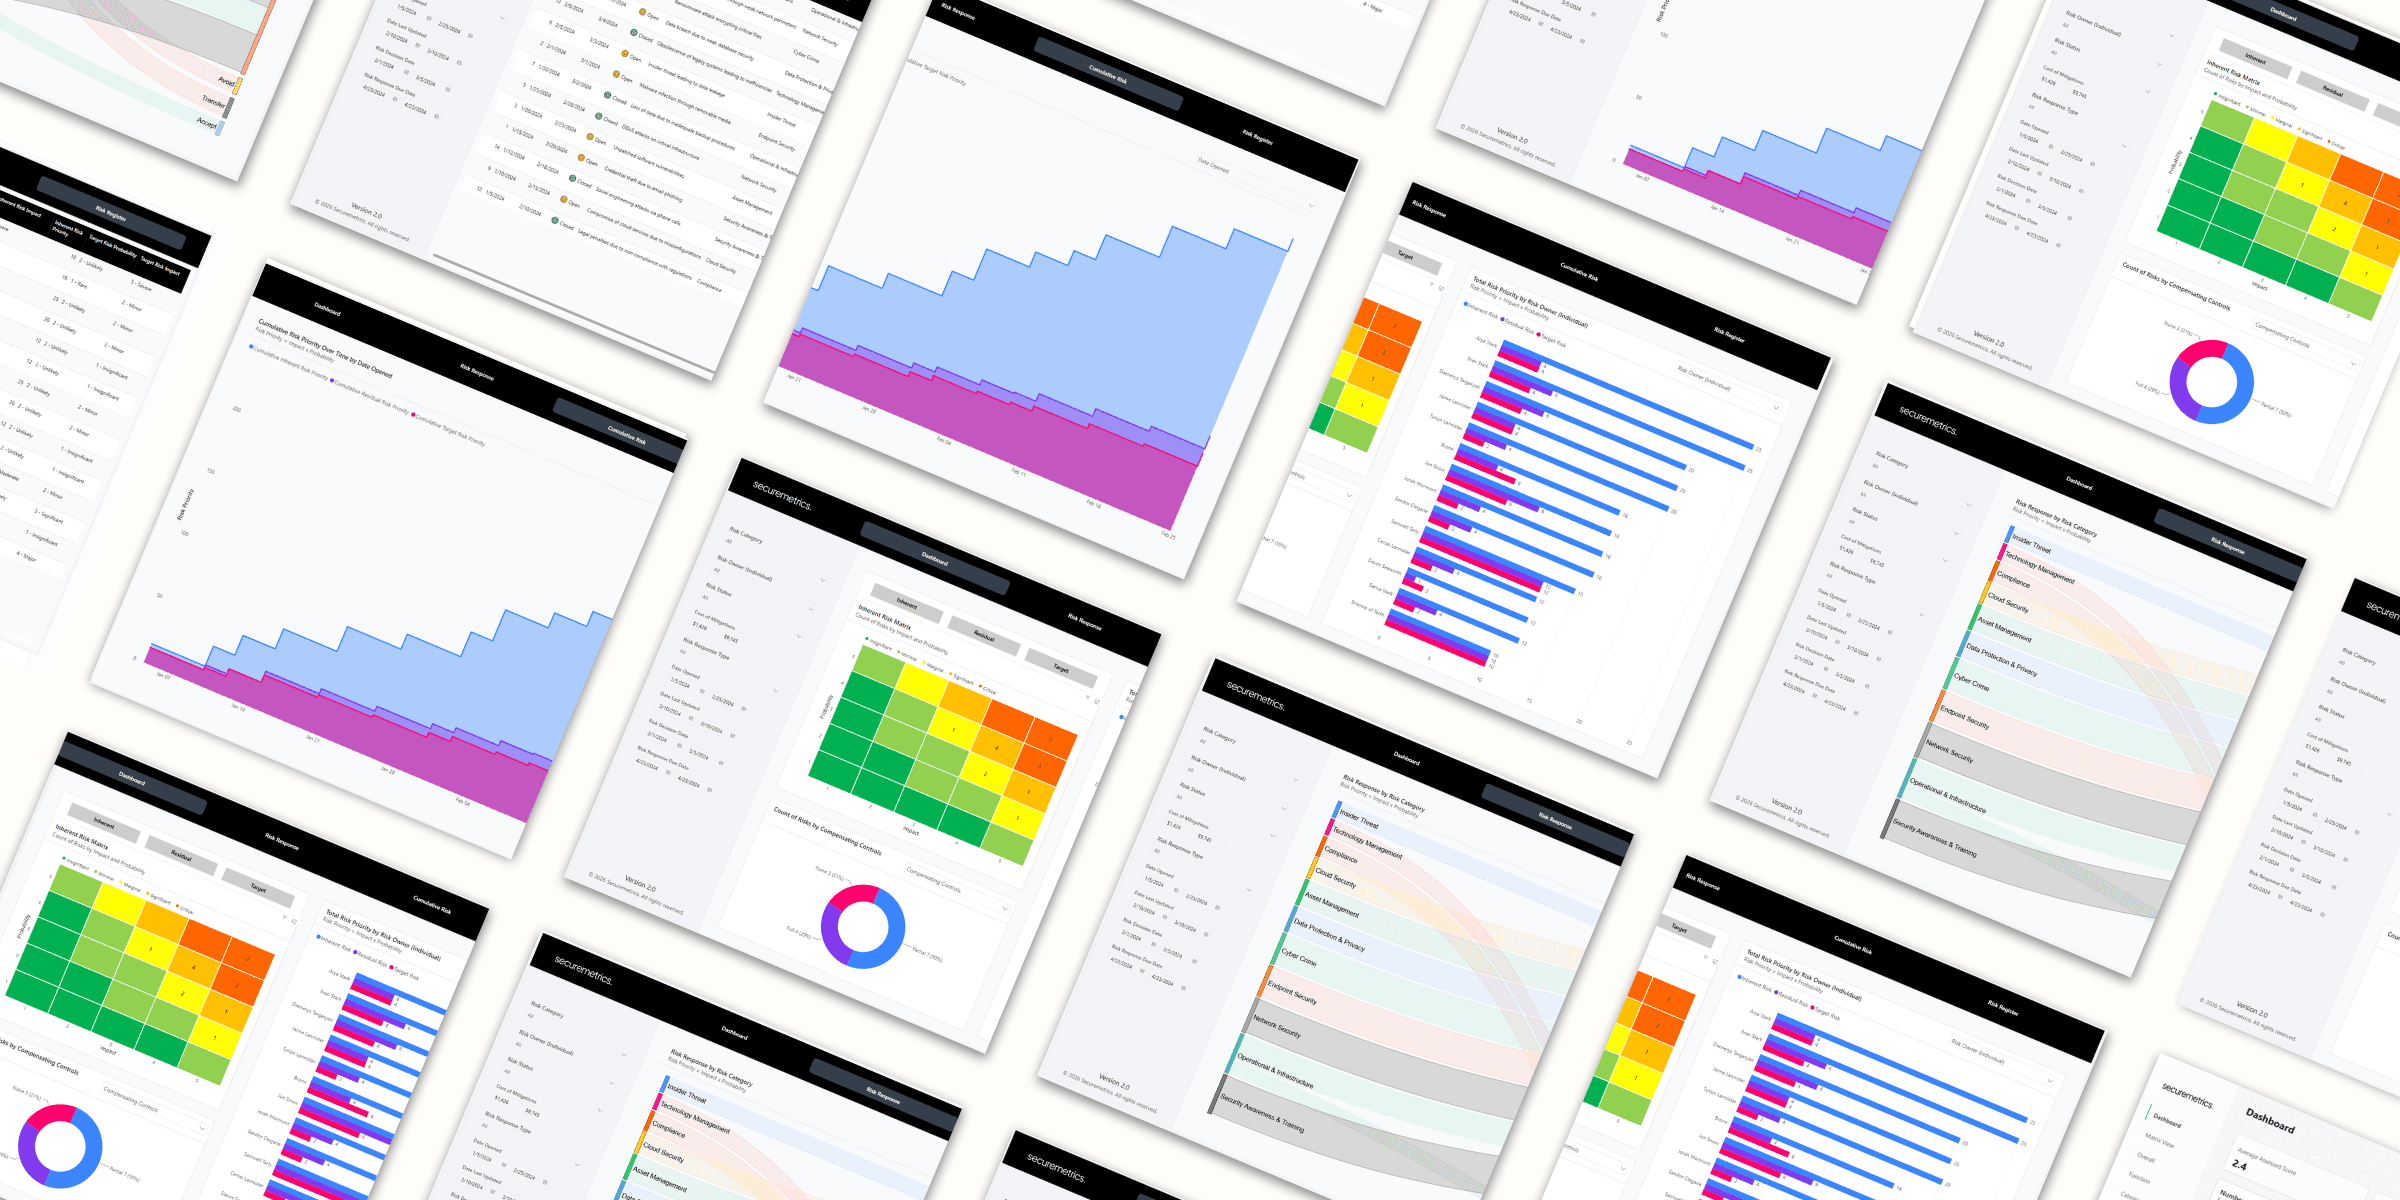
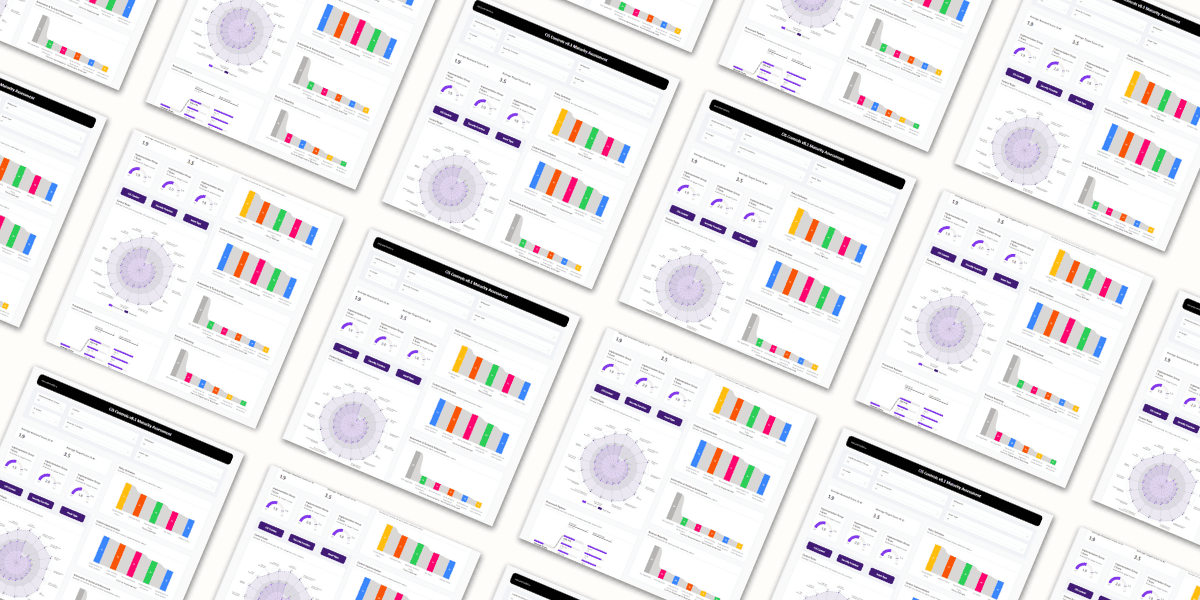
PowerBI Templates
Designed to go from data to reporting in ~10 minutes
"Professional looking and elegent output from a powerful yet easy to use and comprehensive tool." - Gary Webb, Compliance Officer, Open GI Limited

Don't see the template you need? See our full library.
Testimonials
Real words from security professionals
Every story is different, but each one reminds us of how execellent security reporting can change conversations, decisions, and the success of an organization.

Resources
Want to improve your security reporting skills? Start here.
Here you will find guides, articles, and updates to help you improve security reporting.